4. Built-in meshes
This demo is implemented in a single Python file,
demo_built-in.py, and demonstrates use of the built-in
meshes in DOLFIN.
This demo illustrates:
- How to define some of the different built-in meshes in DOLFIN
4.1. Problem definition
The demo focuses on the built-in meshes. We will look at the following meshes:
4.2. Implementation
First, the dolfin module is imported:
from dolfin import *
The first mesh we make is a mesh over the unit interval
\((0,1)\). UnitIntervalMesh takes the number of intervals
\((n_x)\) as input argument, and the total number of vertices is
therefore \((n_x+1)\).
mesh = UnitIntervalMesh(10)
print "Plotting a UnitIntervalMesh"
plot(mesh, title="Unit interval")
This produces a mesh looking as follows:
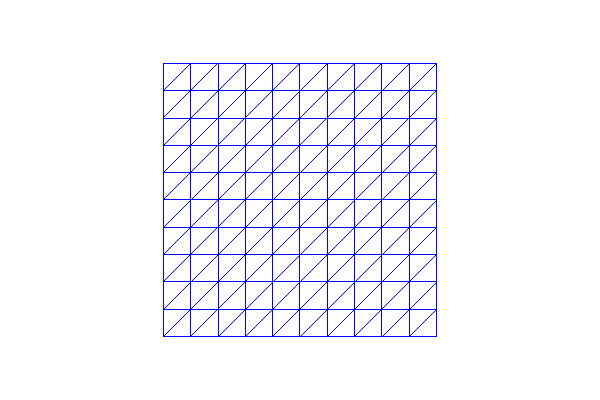
We then make our first version of a mesh on the unit square
\([0,1] \times [0,1]\). We must give the number of cells in the
horizontal and vertical directions as the first two arguments to
UnitSquareMesh. There is a third optional
argument that indicates the direction of the diagonals. This can be
set to “left”, “right”, “right/left”, “left/right”, or “crossed”. We
can also omit this argument and thereby use the default direction
“right”.
mesh = UnitSquareMesh(10, 10)
print "Plotting a UnitSquareMesh"
plot(mesh, title="Unit square")
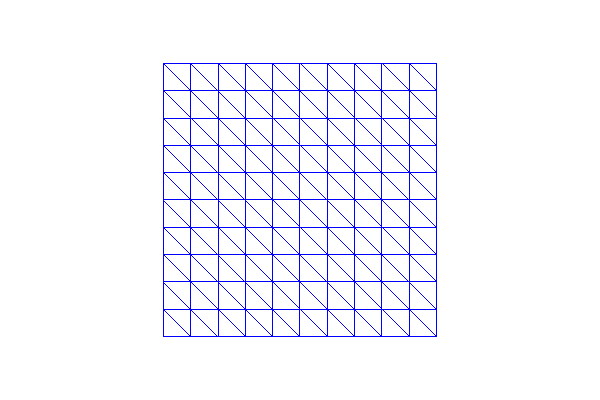
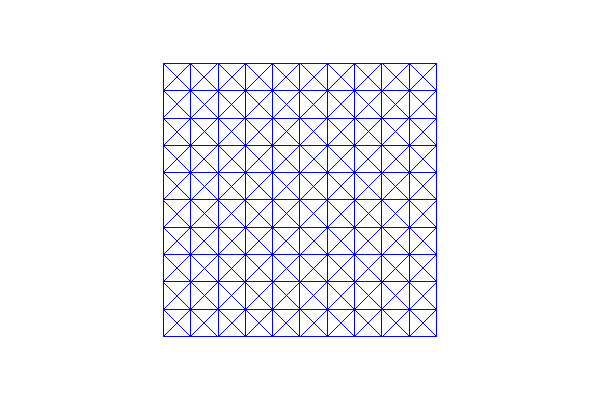
Our second version of a mesh on the unit square has diagonals to the left, the third version has crossed diagonals and our final version has diagonals to both left and right:
mesh = UnitSquareMesh(10, 10, "left")
print "Plotting a UnitSquareMesh"
plot(mesh, title="Unit square (left)")
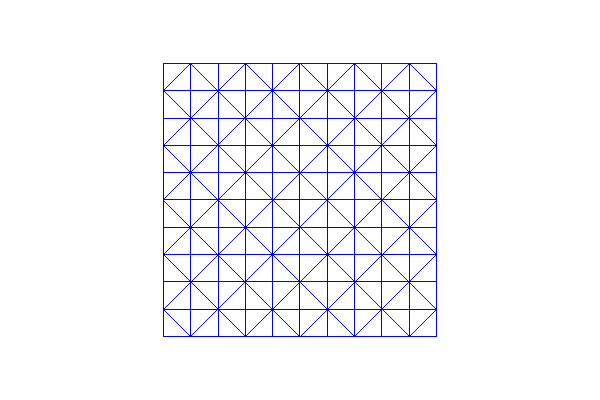
mesh = UnitSquareMesh(10, 10, "crossed")
print "Plotting a UnitSquareMesh"
plot(mesh, title="Unit square (crossed)")
mesh = UnitSquareMesh(10, 10, "right/left")
print "Plotting a UnitSquareMesh"
plot(mesh, title="Unit square (right/left)")
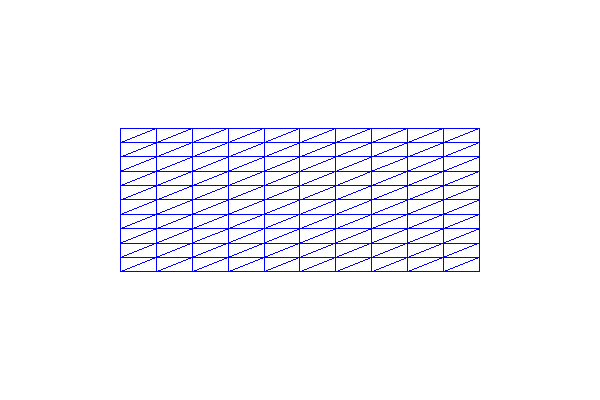
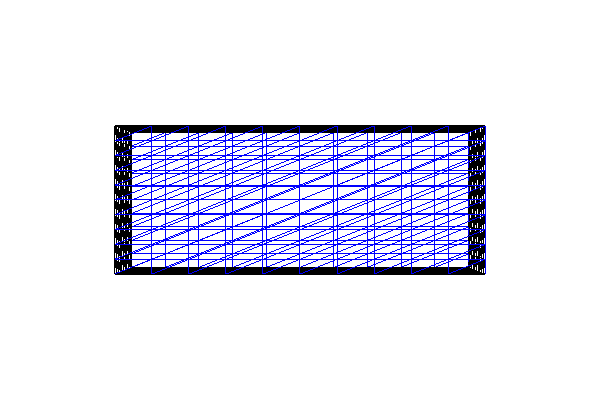
The class RectangleMesh
(\(x_0,y_0,x_1,y_1,n_x,n_y\), direction) creates a mesh on a
rectangle with one corner in \((x_0,y_0)\) and the opposite corner
in \((x_1,y_1)\). \(n_x\) and \(n_y\) specify the number
of cells in the \(x\)- and \(y\)-directions, and as above the
direction of the diagonals is given as a final optional argument
(“left”, “right”, “left/right”, or “crossed”). In the first mesh we
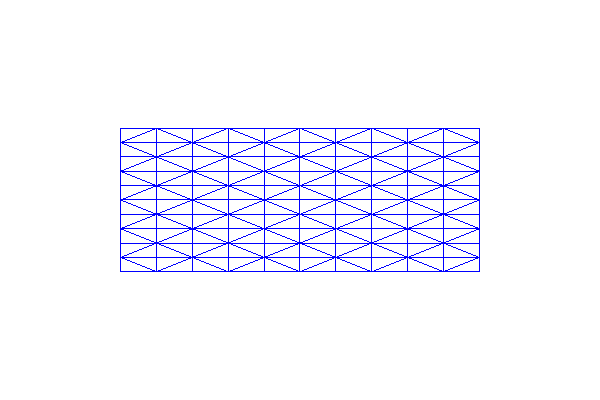
use the default direction (“right”) of the diagonal, and in the second
mesh we use diagonals to both left and right.
mesh = RectangleMesh(0.0, 0.0, 10.0, 4.0, 10, 10)
print "Plotting a RectangleMesh"
plot(mesh, title="Rectangle")

mesh = RectangleMesh(-3.0, 2.0, 7.0, 6.0, 10, 10, "right/left")
print "Plotting a RectangleMesh"
plot(mesh, title="Rectangle (right/left)")
Unstructured ellipsoid and ellipse meshes can be created if DOLFIN is
configured with CGAL. Using CircleMesh For a circle centered at (0, 0)
with radius 1 and cell size 0.2:
mesh = CircleMesh(Point(0.0, 0.0), 1.0, 0.2)
print "Plotting a CircleMesh"
plot(mesh, title="Circle (unstructured)")
Using EllipseMesh for
an ellipse centered at (0, 0) with ‘radii’ of 3 and 1 in the
\(x\)- and \(y\) directions, respectively, and cell size 0.2:
mesh = EllipseMesh(Point(0.0, 0.0), [3.0, 1.0], 0.2)
print "Plotting an EllipseMesh"
plot(mesh, title="Ellipse mesh (unstructured)")
Using SphereMesh for a
sphere centered at (0, 0, 0) with radius 1 and cell size 0.2:
mesh = SphereMesh(Point(0.0, 0.0, 0.0), 1.0, 0.2)
print "Plotting a SphereMesh"
plot(mesh, title="Sphere mesh (unstructured)")
Using EllipsoidMesh
For an ellipsoid centered at (0, 0, 0.0), with ‘radii’ of 3, 1 and 2
in the \(x\)-, \(y\) and :math`z`-directions, respectively,
and cell size 0.2:
mesh = EllipsoidMesh(Point(0.0, 0.0, 0.0), [3.0, 1.0, 2.0], 0.2)
print "Plotting an EllipsoidMesh"
plot(mesh, title="Ellipsoid mesh (unstructured)")
To make a mesh of the 3D unit cube \([0,1] \times [0,1] \times
[0,1]\), we use UnitCubeMesh. UnitCubeMesh takes the number of cells in the
\(x\)-, \(y\)- and \(z\)-direction as the only three
arguments.
mesh = UnitCubeMesh(10, 10, 10)
print "Plotting a UnitCubeMesh"
plot(mesh, title="Unit cube")
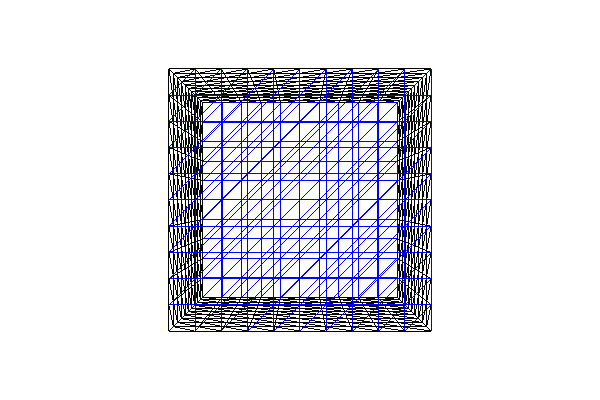
Finally we will demonstrate a mesh on a rectangular prism in
3D. BoxMesh
(\(x_0,y_0,z_0,x_1,y_1,z_1,x_n,y_n,z_n\)) takes the coordinates of
the first corner(\(x_0,y_0,z_0\)) as the three first arguments,
the coordinates of the opposite corner (\(x_1,y_1,z_1\)) as the
next three arguments, while the last three arguments specify the
number of points in the \(x\)-, \(y\)- and
\(z\)-direction.
mesh = BoxMesh(0.0, 0.0, 0.0, 10.0, 4.0, 2.0, 10, 10, 10)
print "Plotting a BoxMesh"
plot(mesh, title="Box")
By calling interactive we are allowed to resize, move
and rotate the plots.
interactive()
4.3. Complete code
from dolfin import *

mesh = UnitIntervalMesh(10)
print "Plotting a UnitIntervalMesh"
plot(mesh, title="Unit interval")

mesh = UnitSquareMesh(10, 10)
print "Plotting a UnitSquareMesh"
plot(mesh, title="Unit square")

mesh = UnitSquareMesh(10, 10, "left")
print "Plotting a UnitSquareMesh"
plot(mesh, title="Unit square (left)")

mesh = UnitSquareMesh(10, 10, "crossed")
print "Plotting a UnitSquareMesh"
plot(mesh, title="Unit square (crossed)")

mesh = UnitSquareMesh(10, 10, "right/left")
print "Plotting a UnitSquareMesh"
plot(mesh, title="Unit square (right/left)")

mesh = RectangleMesh(0.0, 0.0, 10.0, 4.0, 10, 10)
print "Plotting a RectangleMesh"
plot(mesh, title="Rectangle")

mesh = RectangleMesh(-3.0, 2.0, 7.0, 6.0, 10, 10, "right/left")
print "Plotting a RectangleMesh"
plot(mesh, title="Rectangle (right/left)")

if has_cgal():
    mesh = CircleMesh(Point(0.0, 0.0), 1.0, 0.2)
    print "Plotting a CircleMesh"
    plot(mesh, title="Circle (unstructured)")

    mesh = EllipseMesh(Point(0.0, 0.0), [3.0, 1.0], 0.2)
    print "Plotting an EllipseMesh"
    plot(mesh, title="Ellipse mesh (unstructured)")

    mesh = SphereMesh(Point(0.0, 0.0, 0.0), 1.0, 0.2)
    print "Plotting a SphereMesh"
    plot(mesh, title="Sphere mesh (unstructured)")

    mesh = EllipsoidMesh(Point(0.0, 0.0, 0.0), [3.0, 1.0, 2.0], 0.2)
    print "Plotting an EllipsoidMesh"
    plot(mesh, title="Ellipsoid mesh (unstructured)")

mesh = UnitCubeMesh(10, 10, 10)
print "Plotting a UnitCubeMesh"
plot(mesh, title="Unit cube")

mesh = BoxMesh(0.0, 0.0, 0.0, 10.0, 4.0, 2.0, 10, 10, 10)
print "Plotting a BoxMesh"
plot(mesh, title="Box")

interactive()